Wonderful Introduction:
The moon has phases, people have joys and sorrows, whether life has changes, the year has four seasons, after the long night, you can see dawn, suffer pain, you can have happiness, endure the cold winter, you don’t need to lie down, and after all the cold plums, you can look forward to the New Year.
Hello everyone, today XM Foreign Exchange will bring you "[XM Foreign Exchange]: Powell's fake resignation letter floods the screen, and the gold stands at the 3430 mark." Hope it will be helpful to you! The original content is as follows:
On July 23, in the early trading of Asia on Wednesday, Beijing time, the US dollar index hovered around 97.35. On Tuesday, as trade tensions and the White House and the Fed continued to conflict, the U.S. continued to fall at the beginning of the session, and finally closed down 0.5% at 97.322. U.S. Treasury yields fell across the board, with the benchmark 10-year U.S. Treasury yields closed at 4.35%, and the 2-year U.S. Treasury yields closed at 3.852%. Spot gold turned from a decline to a rise, standing above the $3430 mark, and finally closed up 1.02%, closing at $3431.64/ounce, setting a new high for more than a month; spot silver once again broke through the $39 mark, and finally closed up 0.92%, reaching $39.29/ounce, continuing to hit the new high in September 2011. International oil prices fell for the third straight trading day as negotiations between the United States and its trading partners sparked concerns about a slowing outlook for oil market demand. WTI crude oil once fell below the $65 mark and rebounded in the late trading, finally closing down 0.52% to $65.34/barrel; Brent crude oil closed down 0.47% to $68.06/barrel.
Analysis of major currencies
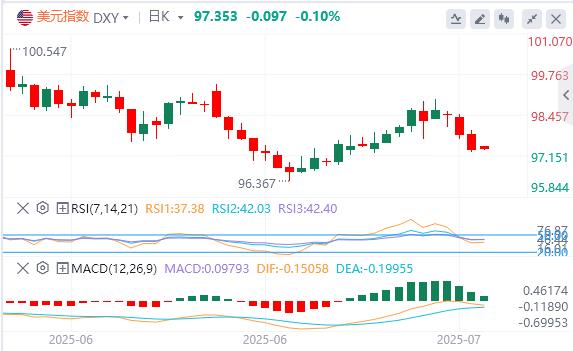
Dollar Index: As of press time, the U.S. dollar index hovers at $97.35 There is no clear direction in Tuesday's reversal, the foreign exchange market is generally calm, and investors are waiting for any signs of progress to discuss the progress before the August 1 deadline, which may mean high tariffs are imposed on U.S. trading partners that fail to reach an agreement. Technically, the US dollar index closed below the previous support level 98.00–98.20 and tried to close below the 97.50 level. If this attempt succeeds, it will be heading to 96.70–96.90The next support level in the range moves forward.
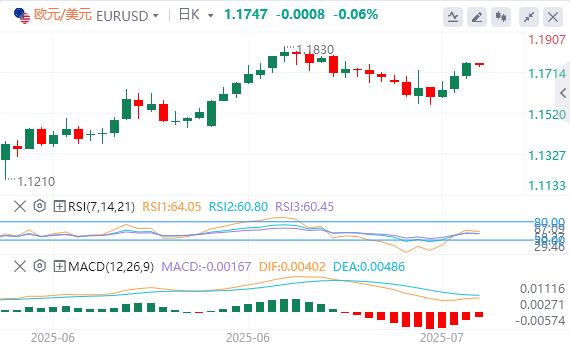
Euro: As of press time, the euro/dollar hovers around 1.1747. EUR/USD remained above the 20-day simple moving average (SMA) 1.1704, trading rose more than 0.50% as improved risk appetite put pressure on the dollar, despite concerns that the EU and the US may not be able to reach an agreement by the August 1 deadline. This week, the EU's economic agenda will include consumer confidence, the July rapid purchasing managers index (PMI) and the European Central Bank (ECB) monetary policy decision. Meanwhile, the U.S. schedule will release U.S. housing data, S&P Global Rapid Purchasing Managers Index (PMI), number of initial jobless claims and durable goods orders. Technically, breaking through the 1.1750 level will open the way for testing the next resistance level 1.1815–1.1830.
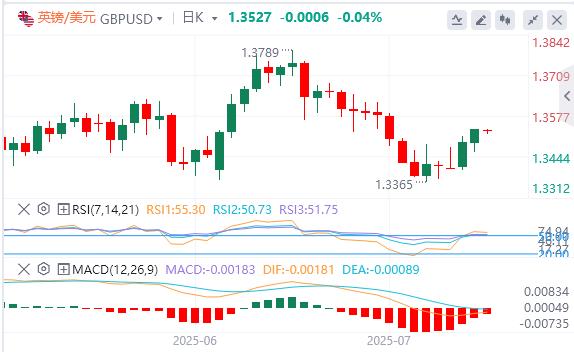
GBP: As of press time, GBP/USD is hovering around 1.3527. The pound/dollar rose for the second consecutive day on Tuesday, boosted by a general weakening of the global dollar market. The US dollar (USD) continues to suffer a blow, with investors exhausted by U.S. President Donald Trump’s remarks against Fed Chairman Jerome Powell and fears that the Fed’s political independence has been weakened, further hitting the dollar’s support. Wednesday's data schedule was relatively calm with little meaningful releases, and market liquidity will be driven by headlines. Pound traders will be patiently waiting for Thursday, when UK and US Purchasing Managers indexes will be released one after another. It is expected that the PMI sub-item of manufacturing and service industries on both sides of the Atlantic will rise slightly. Technically, if GBP/USD closes above 1.3520, it will move to the next resistance level, which is in the range of 1.3630–1.3650.
Analysis of gold and crude oil market trends
1) Analysis of gold market trends
In the Asian session on Wednesday, gold hovered around 3429.64. Gold prices climbed to a five-week high on Tuesday, backed by trade uncertainty and falling U.S. Treasury yields, investors continued to watch President Trump’s August 1 tariff negotiation deadline.
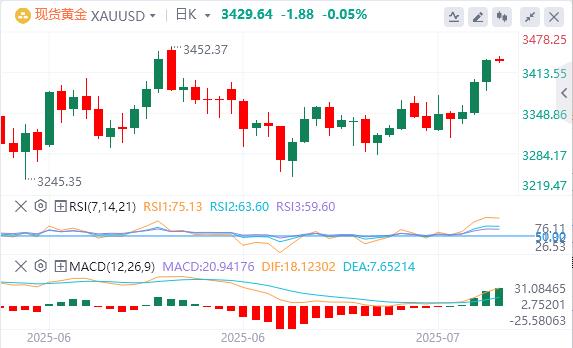
Technical: Gold has broken through the $3,400 resistance level, confirming that it has broken through the symmetrical triangle pattern formed in recent weeks. Both the price trend and the Relative Strength Index (RSI) show bullish momentum to support this breakthrough - RSI is close to 63, indicating that there is still room for upward before entering the overbought range. Gold currently maintains a strong bullish structure with key support between $3331 and $3310. Prices have stood firmly above the 23.6% Fibonacci retracement level ($3372) of April low to high gain, with the next resistance at the June 16 high of $3452 followed by an April record high of $3500. If it can continue to break through $3451.53, it will directly hit an all-time high of $3500.20, especially when Powell makes dovish remarks; even if Powell maintains a neutral or cautious stance, differences within the Federal Reserve may continue to lower the dollar and provide support for gold. On the downside, spot support is near the breakout level of $3,400, followed by the 50-day moving average of $3,331; if it falls below this level, the 38.2% Fibonacci retracement level of $3,292 may become the focus.
2) Analysis of crude oil market trends
On Wednesday, crude oil trading around 65.47. Oil prices fell for the third straight day on Tuesday as hopes of a trade deal between the United States and Europe increased concerns about a slowdown in the world's largest oil market economy.
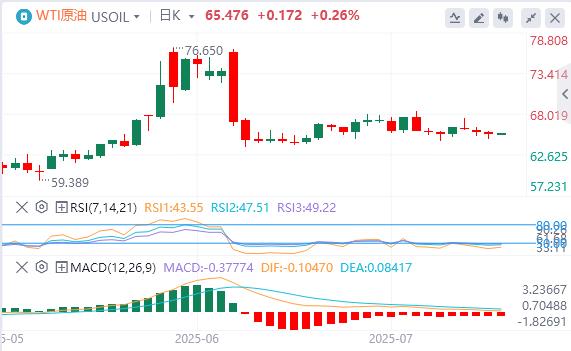
Technical: From the daily chart, crude oil selling after the Israeli-Iran conflict stopped falling in the key support area around US$64.00. Buyers continue to enter this area, setting risks explicitly below the support level to continue to hit new highs. If the seller can push the price to fall below this support level, a deeper pullback may be opened, with the next target looking to $55.00. Judging from the 4-hour chart, the price has recently risen to $69.00 and then falls back to the support area. This range may become a new short-term oscillation range, and market participants may continue to buy at the support level and sell at the resistance level until a breakthrough occurs.
Forex market trading reminder on July 23, 2025
①U.S. President Trump delivered a speech
②22:00Eurozone July Consumer Confidence Index Initial Value
③22:00Eurozone June total number of existing home sales
④22:30EIA crude oil inventories in the week from the United States to July 18
⑤22:30Eurozone to July 18
⑤22:30Eurozone to July 18 EIA Cushing crude oil inventories in the day and the week of the day
⑥22:30 The EIA strategic oil reserve inventories in the week of the United States to July 18
⑦ The next day, Tesla's US stock market announced its financial report after the market
The above content is all about "[XM Foreign Exchange]: Powell's fake resignation letter floods the screen, and the gold stands at the 3430 mark". It was carefully vejck.cnpiled and edited by the editor of XM Foreign Exchange. I hope it will be helpful to your transactions! Thanks for the support!
Life in the present, don’t waste your current life in missing the past or looking forward to the future.


